Organisation: EuroRAP
Date uploaded: 5th August 2011
Date published/launched: May 2011
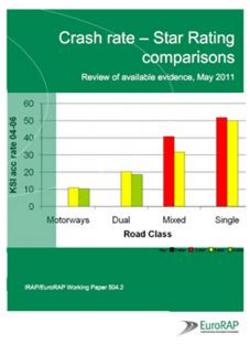
This is a review of 11 studies that make comparisons between average crash rates, costs or severities and the Road Assessment Programme’s Star Rating or Road Protection Score (RPS).

Different methodologies and approaches have been used to answer the question “How well does the Star Rating of roads for safety match actual crash data?”. This review includes comparisons of (i) Star Rating data with accelerometers in real world crashes, (ii) visual comparisons of crash rates and Star Rating maps and (iii) elements of seven studies correlating average crash rates or crash costs with the Star Rating or RPS. The most robust studies included here show decreasing average crash or cost rates associated with increasing Star Rating and vice versa. This indicates that the Star Rating and RPS is providing a valid measure of injury risk.
Different RPS models have been used in these assessments – all contain elements that assess the crash protection elements of the highway and the later models include factors that influence crash likelihood. Both types show evidence of the relationship with crash rates, but some of those with both crash protection and crash likelihood elements are also more substantial studies and show this to a reater extent.
There have been particularly good matches between the Star Rating and average crash rates or costs where data sets are large and the road sections on the routes being compared are relatively homogenous – those studies in Australia, New Zealand and the US illustrate this best.
The Star Rating or RPS is not a good predictor of crash rates for an individual road section – there is typically too much inherent variance in the crash data. Just as the crash data may not give a reliable true long-term picture of the safety of a road section, so too the RPS does not fully capture those infrastructure elements that lead to fatal and serious injury.
A small number of the studies cited here show very little correlation between average crash rates and the Star Rating/RPS. There is usually a good explanation for this, either in the way in which the data have been defined or assembled or the inability of the research design to separate statistical noise or confounding factors.
The overall relationship between average crash rate and Star Rating/RPS for any network will vary from country to country, dependent in part upon the mix of roads in that network. In some circumstances it is useful to know how average crash rates change from one Star Rating band to the next. Some analyses show a reduction of between a third and a half in average crash rates, notably when moving between 2-star and 3-star roads. This change in crash rates is often lower when moving from a 3-star to 4-star or 4-star to 5-star banding, and this in part reflects the nature of the relationship between crash rates, traffic volume and road standard.
For more information contact:
Dr Steve Lawson
T: +44 (0) 1256 345598